
Guide to Distributed Tracing with Istio and OpenTelemetry
Istio is a service mesh that provides an application-aware network using the Envoy service proxy. It is a common solution used in cloud native microservice architectures to simplify traffic management, security, policy enforcement and observability. In this post we will focus on the observability aspects and how to use OpenTelemetry with Istio for distributed tracing.
Istio has built-in support for multiple distributed tracing solutions. It can be configured to capture and send the tracing data to different observability backends including ServiceNow Cloud Observability and supports different tracing formats including OpenTelemetry, OpenTracing and OpenCensus. OpenTelemetry is the evolution of OpenTracing and OpenCensus and is the recommended solution for distributed tracing in today's modern applications. This guide will walk you through installing and configuring Istio with OpenTelemetry.
**notes: this guide is also available as a self-paced workshop
Install Istio
We'll start by getting Istio installed in your Kubernetes cluster and a sample application deployed that we will use for testing. This guide was developed for Istio v1.19. If you run into any problems while following the guide, please check the Istio docs for the most up-to-date installation information.
You must have a cluster running a supported version of Kubernetes before installing Istio. For Istio v.19 the supported versions of Kubernetes are 1.25, 1.26, 1.27 or 1.28. Check out the Istio releases page for information on Kubernetes support by Istio release.
Download and extract Istio
- Use the following command to download and extract the latest Istio release for your operating system (Linux or macOS). For other releases and operating systems, download the your installation file from the Istio releases page.
curl -L https://istio.io/downloadIstio | sh - - Change to the directory where you extracted Istio. For example, if you downloaded the latest using the command above the directory will be istio-1.19.0 (or similar depending on which version you downloaded)
cd istio-1.19.0 - Add istioctl to your PATH (Linux or macOS)
export PATH=$PWD/bin:$PATH
Install Istio in your cluster
- Use istioctl to install Istio in your cluster. The example below uses the demo configuration profile which is the ideal profile for this guide. See the available configuration profiles for more info.
istioctl install --set profile=demo -y - Add the following label to your selected Kubernetes namespace. This instructs Istio to automatically inject Envoy sidecar proxies with your pods in this namespace. Adjust the namespace to the appropriate name if it is not the default namespace.
kubectl label namespace default istio-injection=enabled
Deploy the sample application
The Istio package that you downloaded includes a sample application called Bookinfo that demonstrates the capabilities of Istio. We will install Bookinfo and use it to test our OpenTelemetry configuration later.
- Deploy the Bookinfo application in your cluster. If using a namespace other than the default namespace be sure to add -n NAMESPACE to the following command:
kubectl apply -f samples/bookinfo/platform/kube/bookinfo.yaml - This will deploy the 4 services and 6 pods that make up the Bookinfo application. Ensure your all your pods are reporting READY 2/2 with a STATUS of Running before proceeding to the next step.
kubectl get pods - Run the following command to verify that everything is working correctly. You should get a response with Simple Bookstore App
kubectl exec "$(kubectl get pod -l app=ratings -o jsonpath='{.items[0].metadata.name}')" -c ratings -- curl -sS productpage:9080/productpage | grep -o "<title>.*</title>"
Allow inbound traffic
Now we need to make the Bookinfo application accessible to outside traffic so we can test it. We will use an Istio Ingress Gateway to accomplish this.
- Create the Istio gateway and associate the Bookinfo application.
kubectl apply -f samples/bookinfo/networking/bookinfo-gateway.yaml - Run the analyze command to check for any issues with the configuration.
istioctl analyze - Follow the steps in the Istio documentation to determine the ingress IP and ports.
- Get the external address of the application.
echo "http://$GATEWAY_URL/productpage" - Copy and paste the output from the last command into your browser. You should see the Bookinfo product page displayed
Configure OpenTelemetry tracing
At this point we have Istio installed in the cluster and the Bookinfo app deployed and running. The Envoy proxy sidecars are being added to each of the application pods via the label that was added to the namespace. Now we need to configure distributed tracing using OpenTelemetry and export the tracing data to Cloud Observability. We will do this by deploying an OpenTelemetry Collector in the cluster and configuring Istio to generate and send tracing data to the collector.
- Create a new filed name otel-collector.yaml.
- Add the following ConfigMap to the file.
apiVersion: v1 kind: ConfigMap metadata: name: opentelemetry-collector-conf namespace: istio-system labels: app: opentelemetry-collector data: opentelemetry-collector-config: | receivers: otlp: protocols: grpc: http: processors: batch: exporters: otlp/lightstep: endpoint: ingest.lightstep.com:443 headers: "lightstep-access-token": "<YOUR_TOKEN>" logging: loglevel: debug extensions: health_check: service: extensions: - health_check pipelines: logs: receivers: [otlp] processors: [batch] exporters: [logging] traces: receivers: [otlp] processors: [batch] exporters: [logging, otlp/lightstep] metrics: receivers: [otlp] processors: [batch] exporters: [logging, otlp/lightstep] - Replace with a Lightstep access token for your Cloud Observability project. Review the documentation create and manage access tokens in Cloud Observability to learn how to generate a token for your project.
** note: If you encounter errors after applying this configuration and/or your telemetry data fails to export from the collector to Cloud Observability remove the quotations around your access token. Some environments require the quotations around tokens with special characters while other environments may treat the quotations as part of the token. - Add the following service definition to the file:
apiVersion: v1 kind: Service metadata: name: opentelemetry-collector namespace: istio-system labels: app: opentelemetry-collector spec: ports: - name: grpc-otlp # Default endpoint for OpenTelemetry receiver. port: 4317 protocol: TCP targetPort: 4317 selector: app: opentelemetry-collector - Add the following deployment to the file:
apiVersion: v1 kind: Service metadata: name: opentelemetry-collector namespace: istio-system labels: app: opentelemetry-collector spec: ports: - name: grpc-otlp # Default endpoint for OpenTelemetry receiver. port: 4317 protocol: TCP targetPort: 4317 selector: app: opentelemetry-collector --- apiVersion: apps/v1 kind: Deployment metadata: name: opentelemetry-collector namespace: istio-system spec: selector: matchLabels: app: opentelemetry-collector strategy: rollingUpdate: maxSurge: 1 maxUnavailable: 1 type: RollingUpdate template: metadata: labels: app: opentelemetry-collector sidecar.istio.io/inject: "false" # do not inject spec: containers: - command: - "/otelcol" - "--config=/conf/opentelemetry-collector-config.yaml" env: - name: POD_NAME valueFrom: fieldRef: apiVersion: v1 fieldPath: metadata.name - name: POD_NAMESPACE valueFrom: fieldRef: apiVersion: v1 fieldPath: metadata.namespace image: otel/opentelemetry-collector:0.71.0 imagePullPolicy: IfNotPresent name: opentelemetry-collector ports: - containerPort: 4317 protocol: TCP resources: limits: cpu: "2" memory: 4Gi requests: cpu: 200m memory: 400Mi terminationMessagePath: /dev/termination-log terminationMessagePolicy: File volumeMounts: - name: opentelemetry-collector-config-vol mountPath: /conf dnsPolicy: ClusterFirst restartPolicy: Always schedulerName: default-scheduler terminationGracePeriodSeconds: 30 volumes: - configMap: defaultMode: 420 items: - key: opentelemetry-collector-config path: opentelemetry-collector-config.yaml name: opentelemetry-collector-conf name: opentelemetry-collector-config-vol - Deploy the collector to the istio-system namespace in the cluster.
kubectl apply -f otel-collector.yaml -n istio-system
**note: This example uses a specific version of the collector. To use the latest version or some other preferred version, update the image with the latest version of the opentelemetry-collector. See here for the list of collector releases.
Configure Istio telemetry
Next we need to configure Istio to use OpenTelemetry and send the telemetry data to the collector we just deployed.
- Create a new file named istio-telemetry.yaml.
- Add the following ConfigMap to the file. This configures Istio to use OpenTelemetry for tracing and configures the service (the collector) where it should send the OpenTelemetry data.
apiVersion: v1 kind: ConfigMap metadata: name: istio namespace: istio-system annotations: meta.helm.sh/release-name: istiod meta.helm.sh/release-namespace: istio-system labels: app.kubernetes.io/managed-by: Helm install.operator.istio.io/owning-resource: unknown istio.io/rev: default operator.istio.io/component: Pilot release: istiod data: meshNetworks: |- networks: {} mesh: |- defaultConfig: discoveryAddress: istiod.istio-system.svc:15012 tracing: {} defaultProviders: tracing: - opentelemetry extensionProviders: - name: "opentelemetry" opentelemetry: service: "opentelemetry-collector.istio-system.svc.cluster.local" port: 4317 enablePrometheusMerge: true rootNamespace: null trustDomain: cluster.local - Next add the following Telemetry configuration to the file. This configures Istio to use the configuration created above for telemetry.
apiVersion: telemetry.istio.io/v1alpha1 kind: Telemetry metadata: name: mesh-default namespace: istio-system spec: accessLogging: - providers: - name: opentelemetry tracing: - providers: - name: opentelemetry randomSamplingPercentage: 100 - Deploy the configuration in the istio-system namespace.
kubectl apply -f istio-telemetry.yaml -n istio-system
Restart your workloads
When you update the Istio configuration you must restart your workloads so the sidecars get re-injected with the updated configuration. The following is an example of how to restart a deployment:
kubectl rollout restart deployment -n NAMESPACE DEPLOYMENT_NAME
Restart the Bookinfo deployments before proceeding. The following will give you a list of deployments. If using a namespace other than the default namespace be sure to add -n NAMESPACE to the following command:
kubectl get deployments
Explore the results
Istio is now configured to send OpenTelemetry data to Cloud Observability via a local OpenTelemetry Collector. Let's test our application and review the results.
- Load the Bookinfo product page in your browser again. Refresh the page a few times to generate multiple traces.
- Log in to ServiceNow Cloud Observability.
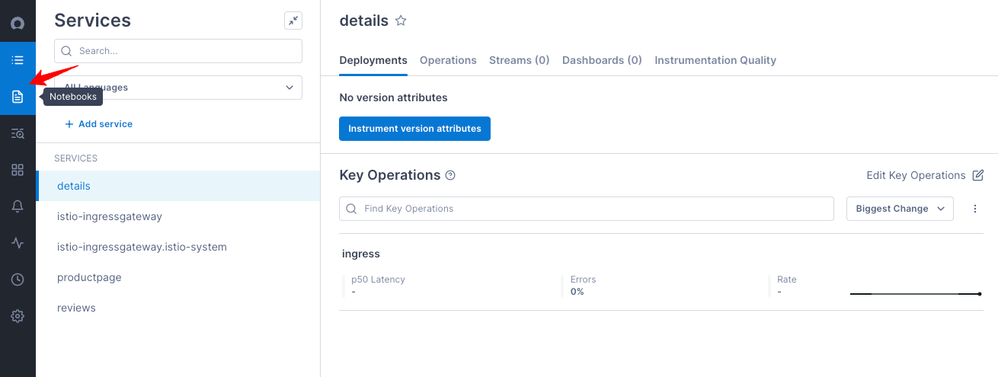
- Click on Notebooks in the side navigation bar.
- In the Unified Query Builder change All telemetry to Spans with
- In the Search for a span attribute key textbox enter service then in the Search for values textbox enter productpage.default and hit enter. This will execute the query to get latency values from all spans for the service productpage.default in the last hour
- Click on the Span samples tab below the chart. This shows a list of all spans that match the query. Click on one of the span records in the table. This will load the trace view for the trace that includes that span in a new tab.
- Review the information that is available in this trace view. You should see a tree of the egress and ingress operations and the amount of latency they contributed as the request flows through the istio-ingressgateway to the productpage and from productpage to the details service. Click on each of the operations and notice the attributes that are populated in the sidebar on the right. You should see rich data about the context of the operation including versions, namespace, protocols, networking details, user agent and more.


You now have Istio configured for tracing with OpenTelemetry with a collector to export the data to Cloud Observability. This data allows you to monitor the health of requests flowing through your services and to build diagrams that visualize your microservice architecture. The rich span data provides important information about the context of requests and enables powerful querying capabilities to aid in your investigations.
All of this was accomplished without needing to modify any of the actual services running in your cluster. This solution allows you to start observing your applications with minimal effort and without the need to involve the service teams.
Additional options
Istio provides some additional configuration options that you may find useful to fine-tune your telemetry data. These options allow you to set the service name reported with the telemetry data and the ability to add custom attributes to the span data.
Configure the service name
The default configuration for Istio sets the service name on the telemetry data to APP_LABEL_AND_NAMESPACE. If there is no app label on the workload it will use istio-proxy instead. The two values are concatenated with a period (ex. my-app.my-namespace) to form the full service name. Istio provides the following options to control how the service name is generated:
https://www.servicenow.com/community/cloud-observability-blog/guide-to-distributed-tracing-with-istio-and-opentelemetry/ba-p/2691762