
Monitoring Apache with OpenTelemetry and Cloud Observability
$ journalctl -u otelcol-contrib -f
…
Mar 30 18:43:37 info otelcol-contrib: 2023-03-30T18:43:37.801-0700        info        service/service.go:140        Everything is ready. Begin running and processing data.
Mar 30 18:43:48 info otelcol-contrib: 2023-03-30T18:43:48.021-0700        info        MetricsExporter        {"kind": "exporter", "data_type": "metrics", "name": "logging", "#metrics": 11}
Mar 30 18:43:48 info otelcol-contrib: 2023-03-30T18:43:48.022-0700        info        ResourceMetrics #0
Mar 30 18:43:48 info otelcol-contrib: Resource SchemaURL:
Mar 30 18:43:48 info otelcol-contrib: Resource attributes:
Mar 30 18:43:48 info otelcol-contrib:      -> apache.server.name: Str(localhost)
Mar 30 18:43:48 info otelcol-contrib:      -> apache.server.port: Str(80)
Mar 30 18:43:48 info otelcol-contrib: ScopeMetrics #0
Mar 30 18:43:48 info otelcol-contrib: ScopeMetrics SchemaURL:
Mar 30 18:43:48 info otelcol-contrib: InstrumentationScope otelcol/apachereceiver 0.68.0
Mar 30 18:43:48 info otelcol-contrib: Metric #0
Mar 30 18:43:48 info otelcol-contrib: Descriptor:
Mar 30 18:43:48 info otelcol-contrib:      -> Name: apache.cpu.time
Mar 30 18:43:48 info otelcol-contrib:      -> Description: Jiffs used by processes of given category.
Mar 30 18:43:48 info otelcol-contrib:      -> Unit: {jiff}
Mar 30 18:43:48 info otelcol-contrib:      -> DataType: Sum
Mar 30 18:43:48 info otelcol-contrib:      -> IsMonotonic: true
Mar 30 18:43:48 info otelcol-contrib:      -> AggregationTemporality: Cumulative
Mar 30 18:43:48 info otelcol-contrib: NumberDataPoints #0
Mar 30 18:43:48 info otelcol-contrib: Data point attributes:
Mar 30 18:43:48 info otelcol-contrib:      -> level: Str(children)
Mar 30 18:43:48 info otelcol-contrib:      -> mode: Str(user)
Mar 30 18:43:48 info otelcol-contrib: StartTimestamp: 2023-03-31 01:43:37.779914959 +0000 UTC
Mar 30 18:43:48 info otelcol-contrib: Timestamp: 2023-03-31 01:43:47.845740707 +0000 UTC
Mar 30 18:43:48 info otelcol-contrib: Value: 0.000000
Mar 30 18:43:48 info otelcol-contrib: NumberDataPoints #1
Mar 30 18:43:48 info otelcol-contrib: Data point attributes:
Mar 30 18:43:48 info otelcol-contrib:      -> level: Str(self)
Mar 30 18:43:48 info otelcol-contrib:      -> mode: Str(user)
Mar 30 18:43:48 info otelcol-contrib: StartTimestamp: 2023-03-31 01:43:37.779914959 +0000 UTC
Mar 30 18:43:48 info otelcol-contrib: Timestamp: 2023-03-31 01:43:47.845740707 +0000 UTC
Mar 30 18:43:48 info otelcol-contrib: Value: 0.000000
Mar 30 18:43:48 info otelcol-contrib: NumberDataPoints #2
Mar 30 18:43:48 info otelcol-contrib: Data point attributes:
Mar 30 18:43:48 info otelcol-contrib:      -> level: Str(self)
Mar 30 18:43:48 info otelcol-contrib:      -> mode: Str(system)
Mar 30 18:43:48 info otelcol-contrib: StartTimestamp: 2023-03-31 01:43:37.779914959 +0000 UTC
Mar 30 18:43:48 info otelcol-contrib: Timestamp: 2023-03-31 01:43:47.845740707 +0000 UTC
Mar 30 18:43:48 info otelcol-contrib: Value: 0.000000
Mar 30 18:43:48 info otelcol-contrib: NumberDataPoints #3
Mar 30 18:43:48 info otelcol-contrib: Data point attributes:
Mar 30 18:43:48 info otelcol-contrib:      -> level: Str(children)
Mar 30 18:43:48 info otelcol-contrib:      -> mode: Str(system)
Mar 30 18:43:48 info otelcol-contrib: StartTimestamp: 2023-03-31 01:43:37.779914959 +0000 UTC
Mar 30 18:43:48 info otelcol-contrib: Timestamp: 2023-03-31 01:43:47.845740707 +0000 UTC
Mar 30 18:43:48 info otelcol-contrib: Value: 0.000000
…
Now that you've verified proper metrics collection, you're ready to start exporting those metrics to Cloud Observability.
Send metrics from the OpenTelemetry Collector to Cloud Observability
After you sign into your Cloud Observability account, you’ll need to create an access token. You'll use this token in your Collector configuration, as the Collector needs to authenticate its requests when sending metrics data to Cloud Observability.
Navigate to Project Settings > Access Tokens. Click on Create New to create a new access token. Copy the token value.
Please note: Cloud Observability continues to use lightstep (the former product name) in code for ongoing compatibility.
Now, you’ll replace the logging exporter in your configuration. Next, you'll use an exporter to ship your data to Cloud Observability with OTLP. Modify /etc/otelcol-contrib/config.yaml to look like this:
receivers:
  apache:
    endpoint: "http://localhost:80/server-status?auto"
    collection_interval: 10s

processors:
  batch:

exporters:
  otlp/lightstep:
    endpoint: ingest.lightstep.com:443
    headers: {"lightstep-access-token": "INSERT YOUR TOKEN HERE"}

service:
  pipelines:
    metrics:
      receivers: [apache]
      processors: [batch]
      exporters: [otlp/lightstep]
Make sure to insert your own access token, and then restart the Collector:
$ sudo systemctl restart otelcol-contrib
With your Collector gathering metrics from Apache and sending them to Lightstep, you can begin putting together some charts.
Work with metrics in Cloud Observability
In Cloud Observability, you’ll create a dashboard for your Apache metrics. Then, you'll add a few charts to the dashboard in order to visualize the metrics. You'll create some basic charts, but additional examples of dashboards and charts can be found here.
Create a dashboard
On the Dashboard pages, click on Create Dashboard. Provide a name and a description for your dashboard.

Add a chart
Now, add rour first chart. You'll want a “big number” chart that shows the current load that Apache is putting on your host CPU. First, click Add a chart.

Name your chart “Current Load on CPU”.

The Query Builder in Cloud Observability lets you build your query using a helpful UI of drop-downs and options. If you’re familiar with our Unified Querying Language (UQL) (learn more here), then you can write your queries directly by using the Query Editor.
For now, use the Query Builder to keep this simple. Start by selecting the type of telemetry that you want to chart: Metric.

Because Cloud Observability will display all the metrics (not just the ones from Apache) that are sent to your account, you might see a long list. By typing “Apache” in the search box, you can filter down to just those metrics related to your Apache server. Find and select the metric called apache.cpu.load.

Initially, you're shown a line chart that shows Apache’s load on the CPU over the last 60 minutes.

What you're interested in is the current load (or the latest value). For this, change the View as chart type, select Big number instead.

Now, you'll see a chart with the single number. The number represents a percentage, so change the subtitle to add in “%”. Once you save your chart, it shows up in your dashboard.

Additional charts
Next, add a line chart that shows current connections to your Apache server. For this chart, use the apache.current_connections metric. Again, you'll be shown a line chart with connection counts from the last 60 minutes.

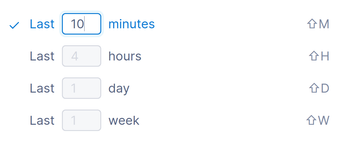
You can adjust the time range for the chart if you're interested in specific windows of time. For example, you can adjust the chart to see just the last 10 minutes.

After you apply this change, the chart looks like this:

Save your chart to add it to the dashboard.
Now, create one more chart. For this one, you're interested in the apache.traffic metric. This is a cumulative metric as opposed to the metrics charted so far, which were both gauges. Because apache.traffic is a running count that’s always increasing, you're more interested in the rate of change.
Cloud Observability knows this, so it aggregates the data to display rate. Set your chart to be an Area type chart. The resulting view shows the traffic in terms of bytes per second at any given moment. Again, look at your chart with the “last 10 minutes” time range.

After you save your charts (and even create a few more), your dashboard looks like this:

Set up alerts and notifications
Although viewing Apache metrics in real time is helpful, you'll benefit even more if you can set up alerts and automated notifications whenever a certain metric reaches a critical threshold. For example, if you set up an alert if the rate of incoming requests exceeds 100 requests per second, it might be indicative of a coordinated DDoS attack.
To do this, click on Alerts in the navbar on the left.

Next, click Create an alert.

The metric you’ll monitor is apache.requests. You’ll aggregate this metric to look at the rate over an input window of 30 seconds.

For the alert configuration, set a critical threshold of 100.

For this example, you'll run a load test script to hit your Apache server with lots of requests. Your alert setup page shows when the metric passes the critical threshold you set.

Finally, for notification rules, you can choose how you want to be notified whenever the alert is triggered. You can choose from ServiceNow, PagerDuty, Slack, BigPanda, or webhooks.

After we save our alert, Cloud Observability begins watching the apache.requests metric. Whenever the rate of requests spike past our threshold, we’ll receive a notification.
Conclusion
Apache web server metrics can give you early indicators of traffic spikes or excess load. Traffic spikes might be the result of valid user visits. Perhaps a new marketing campaign just dropped, and lots of interested users are clicking links to visit your site. Or, a spike in incoming requests could be a sign of a coordinated DDoS attack.
Monitoring your Apache metrics, especially those related to connections, requests, and traffic, can ensure your team is always aware of what’s going on with your web server. By using the OpenTelemetry Collector to gather metrics in conjunction with Cloud Observability for dashboards and alerts, you set your team up for quick and efficient incident response.
https://www.servicenow.com/community/cloud-observability-blog/monitoring-apache-with-opentelemetry-and-cloud-observability/ba-p/2682166