
Monitoring PostgreSQL with OpenTelemetry and Cloud Observability
Configure a Collector receiver
The Collector primarily consists of three components:
- Receivers collect data from data sources, either by push or pull.
- Processors operate on data between its point of collection and export, performing operations such as filtering or transformation.
- Exporters ship the data out of the Collector, whether that be to a simple local logging console or to a remote backend like Cloud Observability.
To get started, we must configure our postgresql receiver by editing the Collector configuration file found at ``/etc/otelcol-contrib/config.yaml. Our simple configuration file, in its entirety, looks like this:
receivers:
  postgresql:
    username: otel
    password: otelpassword


processors:
  batch:

exporters:
  logging:
    verbosity: detailed

service:
  pipelines:
    metrics:
      receivers: [postgresql]
      processors: [batch]
      exporters: [logging]
We have configured the postgresql receiver with the username and password we set up in PostgreSQL. We will use the standard batch processor
, which batches incoming data and compresses it for more efficient exporting.
Finally, we’ll use the logging exporter, which is configured with verbosity set to detailed. We’ll do this initially just to verify that the Collector is properly capturing metrics from PostgreSQL, but we’ll change our exporter later.
Next, we restart the Collector.
$ sudo systemctl restart otelcol-contrib
To verify that the Collector is receiving metrics from our database, we run the following command:
$ journalctl -u otelcol-contrib -f
...
InstrumentationScope otelcol/postgresqlreceiver 0.68.0
Metric #0
Descriptor:
     -> Name: postgresql.backends
     -> Description: The number of backends.
     -> Unit: 1
     -> DataType: Sum
     -> IsMonotonic: false
     -> AggregationTemporality: Cumulative
NumberDataPoints #0
StartTimestamp: 2022-12-28 05:43:05.738132562 +0000 UTC
Timestamp: 2022-12-28 05:43:35.772060409 +0000 UTC
Value: 3
Metric #1
Descriptor:
     -> Name: postgresql.commits
     -> Description: The number of commits.
     -> Unit: 1
     -> DataType: Sum
     -> IsMonotonic: true
     -> AggregationTemporality: Cumulative
NumberDataPoints #0
StartTimestamp: 2022-12-28 05:43:05.738132562 +0000 UTC
Timestamp: 2022-12-28 05:43:35.772060409 +0000 UTC
Value: 159813
Metric #2
Descriptor:
     -> Name: postgresql.db_size
     -> Description: The database disk usage.
     -> Unit: By
     -> DataType: Sum
     -> IsMonotonic: false
     -> AggregationTemporality: Cumulative
NumberDataPoints #0
StartTimestamp: 2022-12-28 05:43:05.738132562 +0000 UTC
Timestamp: 2022-12-28 05:43:35.772060409 +0000 UTC
Value: 8168303
...
We’ve verified that the Collector is receiving metrics from PostgreSQL. Now, we’re ready to export those metrics to Cloud Observability.
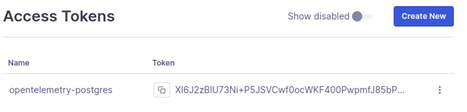
After you’ve logged in, you can navigate to Project Settings, and then to the Access Tokens page. Create a new access token which your Collector will use for authentication when exporting its data to Cloud Observability.

Configure the Collector to export to Cloud Observability
Now that we have a Cloud Observability access token, we will need to modify our Collector configuration (found at /etc/otelcol-contrib/config.yaml). It should look like this:
receivers:
  postgresql:
    username: otel
    password: otelpassword

processors:
  batch:

exporters:
  logging:
    verbosity: detailed
  otlp/lightstep
    endpoint: ingest.lightstep.com:443
    headers: {"lightstep-access-token": "INSERT YOUR TOKEN HERE"}

service:
  pipelines:
    metrics:
      receivers: [postgresql]
      processors: [batch]
      exporters: [otlp/lightstep]
Please note: Cloud Observability continues to use
lightstep(the former product name) in code
for ongoing compatibility.
We’ve configured a new exporter, which we call otlp/lightstep. This otlp exporter uses the OpenTelemetry Protocol (OTLP); we give it a unique name for our use of the exporter by adding /lightstep to our exporter configuration. We use the standard endpoint, and we paste in our access token from the previous step.
Finally, we restart the Collector.
$ sudo systemctl restart otelcol-contrib
Those are all of the steps we need to take on the Collector side. Now, we can move to Cloud Observability to start thinking about queries and alerts.
In this section, we’ll cover some basic usage of Cloud Observability. However, more detailed usage steps and examples can be found here.
Creating a dashboard
We can begin by creating a dashboard with charts of various PostgreSQL metrics that the Collector has captured. On the Dashboards page, click on Create Dashboard.

On the New Dashboard page, we can provide a name and a description for our dashboard.

Adding a chart
Next, we click on Add a chart. For the new chart, we provide a title for the chart. We can use the query builder to build a query around a specific metric or set of metrics.

With “Metric” selected, we can begin typing in the search box. We are shown suggestions that begin with postgresql, which show metrics that are coming through the Collector.

For example, we can choose postgresql.backends to plot the number of client connections to our PostgreSQL instance. After opening several terminals to make several connections to PostgreSQL, we begin to see data plotted like the following:

We can adjust the time range for our query. For example, we can adjust the chart to show the last 15 minutes.

The resulting chart looks like this:

Adding multiple metrics to a chart
We can add another metric to this chart, such as postgresql.connection.max.

The resulting chart now shows both metrics, with active connections in blue (all in the 6-10 connections range) and max connections in purple (fixed at 100).

Working with formulas
Although seeing the number of active connections and max connections is helpful, it would be more useful for us to see the proportion of active connections to max connections. For this, we continue working within the present cart, but we click on Add a formula.

The active connections metric is labeled (by Cloud Observability) as a, while the max connections metric is labeled as b. To express the percentage of our allowable connections that is currently active, we would write a formula like this:

Then, we toggle what our chart displays, showing only the resulting percentage value while hiding the raw metrics. We do this by checking the box for our formula but unchecking the boxes for metrics a and b.

The resulting chart looks like this:

Max connections is set to 100, therefore, an active connection count of eight will result in an active connections proportion of 8%. However, if we modify the configuration of our PostgreSQL instance to set the max connections to 20, our chart would look like this:

Quite quickly, our proportion of active connections jumps from around 4% (which is 4 out of 100) to 20% (which is 4 out of 20).
We change the type of our chart to show Area rather than Line, and then we rename our chart to “% of Connections Active.” Finally, we save our chart. Our dashboard, with one chart, now looks like this:

Adding multiple charts to a dashboard
After adding several charts, each with its own query, our dashboard begins to take shape.

Working with UQL in the Query Editor
Returning to our “% of Connections Active” query, you’ll recall how we originally used the Query Builder to create this query. If you’re familiar with UQL, you can also create your queries directly with the Query Editor. The equivalent of the query we created, in UQL, looks as follows:

Creating an alert
Lastly, we can also create alerts on our queries. Within our chart, we click on Create an alert.

We can configure our alert to trigger based on certain conditions related to our formula. For example, we can set a “critical threshold” at 80% of allowable connections active. We can also set a “warning threshold” at 60%.
Then, we can configure how Cloud Observability should notify us when these thresholds are reached. We can set up a notification to a generic webhook, Slack, or other destinations.

Conclusion
In this walkthrough, we guided you through the setup of the OpenTelemetry Collector to receive metrics from PostgreSQL and export them to Cloud Observability for querying, analysis, and alerting. Throughout this series, we’ll provide guides for connecting other components in your tech stack with the Collector and Cloud Observability.
Whether your organization is running a web application, an ML-backed data pipeline, or business-critical service integrations, you likely run PostgreSQL, and the performance and uptime of your PostgreSQL instances are essential to the success of your business. By monitoring key PostgreSQL metrics related to connections, resource usage, and transaction throughput, you can quickly detect and even preempt performance issues that might cripple your PostgreSQL-dependent systems and impact your operational efficiency.
For more information on what we’ve covered, check out the following resources:
https://www.servicenow.com/community/cloud-observability-blog/monitoring-postgresql-with-opentelemetry-and-cloud-observability/ba-p/2671951